Strategic review of KPIs to focus on
Combined Strategic and Data Consulting
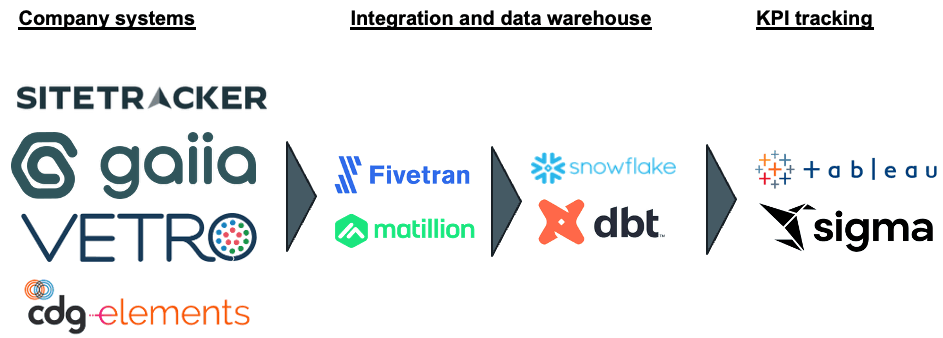
Data ingestion and data warehouse setup
Data pipelines to dashboards
Where PE funds lose time
It takes months to build up even basic KPI tracking capabilities in new investments.
Each portco defines KPIs differently, making cross-portfolio benchmarking inconsistent and slow.
Data engineering consultants are too technical and do not grasp the strategic and business issues.
Operating partners lose time reconciling numbers instead of driving value-creation actions.
Offered solutions
Data to Dashboard
Data source data ingestion into a single data warehouse. Metric standardization. Regular data refreshes. Up to date KPIs for portfolio businesses and boards to track.
Competitive Intelligence Agents
Deal and operations support in collecting competitive insights, going from raw collected data to interactive insights reports in a day.
Case study: Data structuring approach for Fiber companies
Case study
Midwest Fiber Operator
FTTH InfrastructureApprox. 30k passings and active market expansion
Leadership and investors were receiving inconsistent numbers for cost-per-passing and project progress due to fragmented data ownership.
Approach
- Aligned KPI definitions between management and shareholder stakeholders.
- VETRO, Quickbooks and project planning datasets for aggregated build KPIs
- Established daily refresh for data pipelines
Results
- Reached first executive dashboard release in two weeks and full KPI suite in ten weeks.
- Reduced recurring KPI disputes in weekly leadership reviews by standardizing metric logic.
- Improved confidence in build economics reporting for board-level discussions.
About Me

Activated cost per passing tracking in weeks for 2 growing telcos
Delivered a turnaround strategy for an industrial services business leading to EBITDA uplift by 60%
Adomas Malaiska is a former strategy consultant to UK's large corporates turned data and AI specialist. He works closely with PE funds and portcos to set up data systems and AI tooling.
View LinkedInBook an Intro Call
In 30 minutes, get a practical read on your portfolio analytics maturity and the highest-impact implementation priorities.